Every March, advanced metrics become a popular reference point for evaluating men’s NCAA Tournament teams. KenPom rankings, which measure adjusted offensive and defensive efficiency, have historically revealed patterns among championship contenders and deep tournament runs.
From efficiency margins to balanced offensive and defensive profiles, certain statistical benchmarks appear repeatedly among teams that advance far in the men’s March Madness bracket.
Below, FOX Sports Research has broken down which KenPom trends have been most common among Final Four and national title teams.
This page may contain affiliate links to legal sports betting partners. If you sign up or place a wager, FOX Sports may be compensated. Read more about Sports Betting on FOX Sports.
Key Trends
The following trends were found using pre-tournament KenPom data, not final rankings data:
- 23 of the last 24 national champions have ranked in the top 21 of KenPom’s adjusted offensive efficiency (AOE) metric.
- 22 of those 24 also ranked in the top 31 of its adjusted defensive efficiency (ADE) metric.
- All of the last 24 national champions ranked in the top 25 of KenPom’s adjusted efficiency margin (AEM), which factors in both metrics along with other statistical categories.
- Of the last 24 national champions, 14 have ranked in the top 100 of adjusted tempo ranking but six have ranked 200th or worse.
- Of the last 24 national champions, only three ranked in the top 60 of KenPom’s non-conference strength of schedule rating.
- Of the last 24 national champions, 11 ranked in the top 100 of KenPom’s luck rating.
- Of the 25 double-digit seeds to have made the Sweet 16 from non-major conferences since 2001, the average adjusted offensive efficiency rank for those teams was 63.48, the average adjusted defensive efficiency rank was 79.76, the average adjusted efficiency margin rank was 55.08, and the average adjusted tempo rank was 168.16.
[MEN’S BRACKET: NCAA Tournament Bracket, Leaders & Stats]
promedio del campeonato nacional
Aquí están las clasificaciones promedio de la División I de cada campeón nacional desde 2001:
- Adjusted offensive efficiency: 8.25
- Adjusted defensive efficiency: 16.33
- Adjusted efficiency margin: 5.17
- Adjusted tempo: 133.79
Los últimos cuatro promedios
- Adjusted offensive efficiency rank: 18.47
- Adjusted defensive efficiency rank: 22.96
- Adjusted efficiency margin rank: 11.24
- Adjusted tempo rank: 170.57
[NCAA ODDS: Latest Men’s March Madness Odds, Favorites]
El equipo iguala el título de los anteriores campeones.
Al ingresar al torneo, había nueve equipos clasificados entre los 21 primeros en eficiencia ofensiva ajustada y los 31 primeros en eficiencia defensiva ajustada:
Duque
- Adjusted offensive efficiency rank: 4
- Adjusted defensive efficiency rank: 2
- Adjusted efficiency margin rank: 1
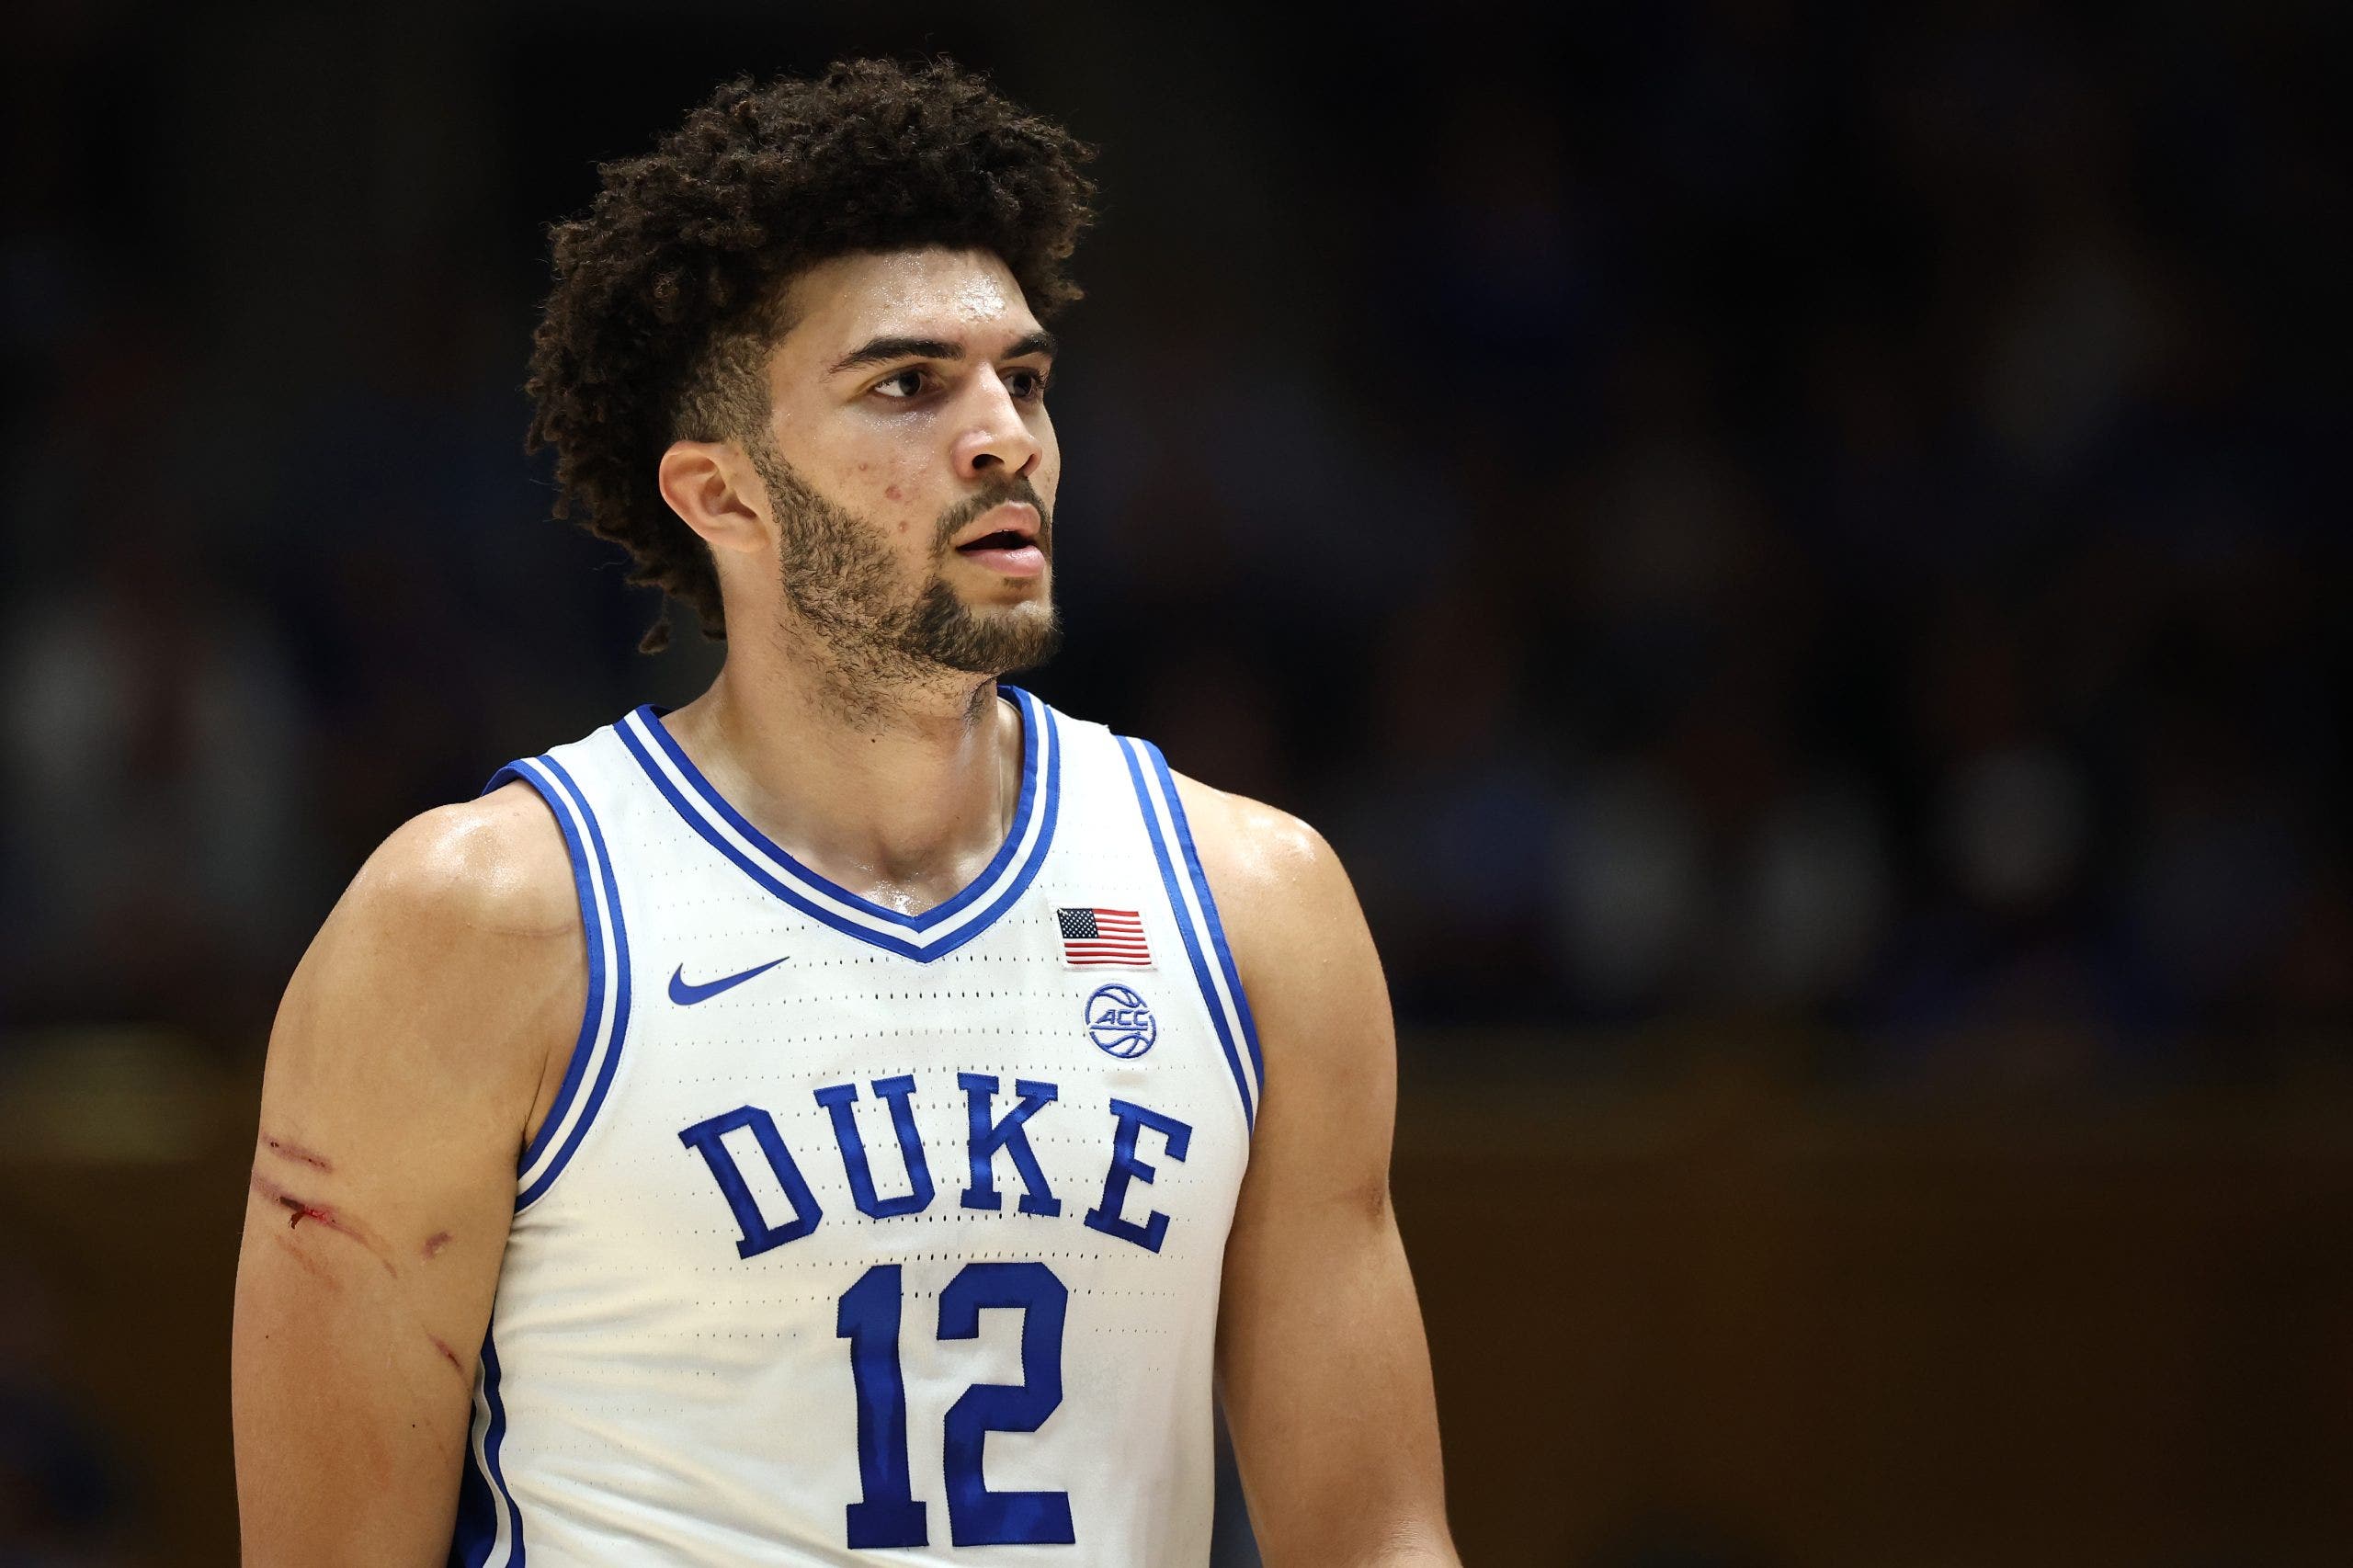
Cameron Boozer de los Duke Blue Devils. (Foto de Jared C. Tilton/Getty Images)
Illinois
- Adjusted offensive efficiency rank: 2
- Adjusted defensive efficiency rank: 28
- Adjusted efficiency margin rank: 7
Arizona
- Adjusted offensive efficiency rank: 5
- Adjusted defensive efficiency rank: 3
- Adjusted efficiency margin rank: 2
Vanderbilt
- Adjusted offensive efficiency rank: 7
- Adjusted defensive efficiency rank: 31
- Adjusted efficiency margin rank: 12
Michigan
- Adjusted offensive efficiency rank: 8
- Adjusted defensive efficiency rank: 1
- Adjusted efficiency margin rank: 3
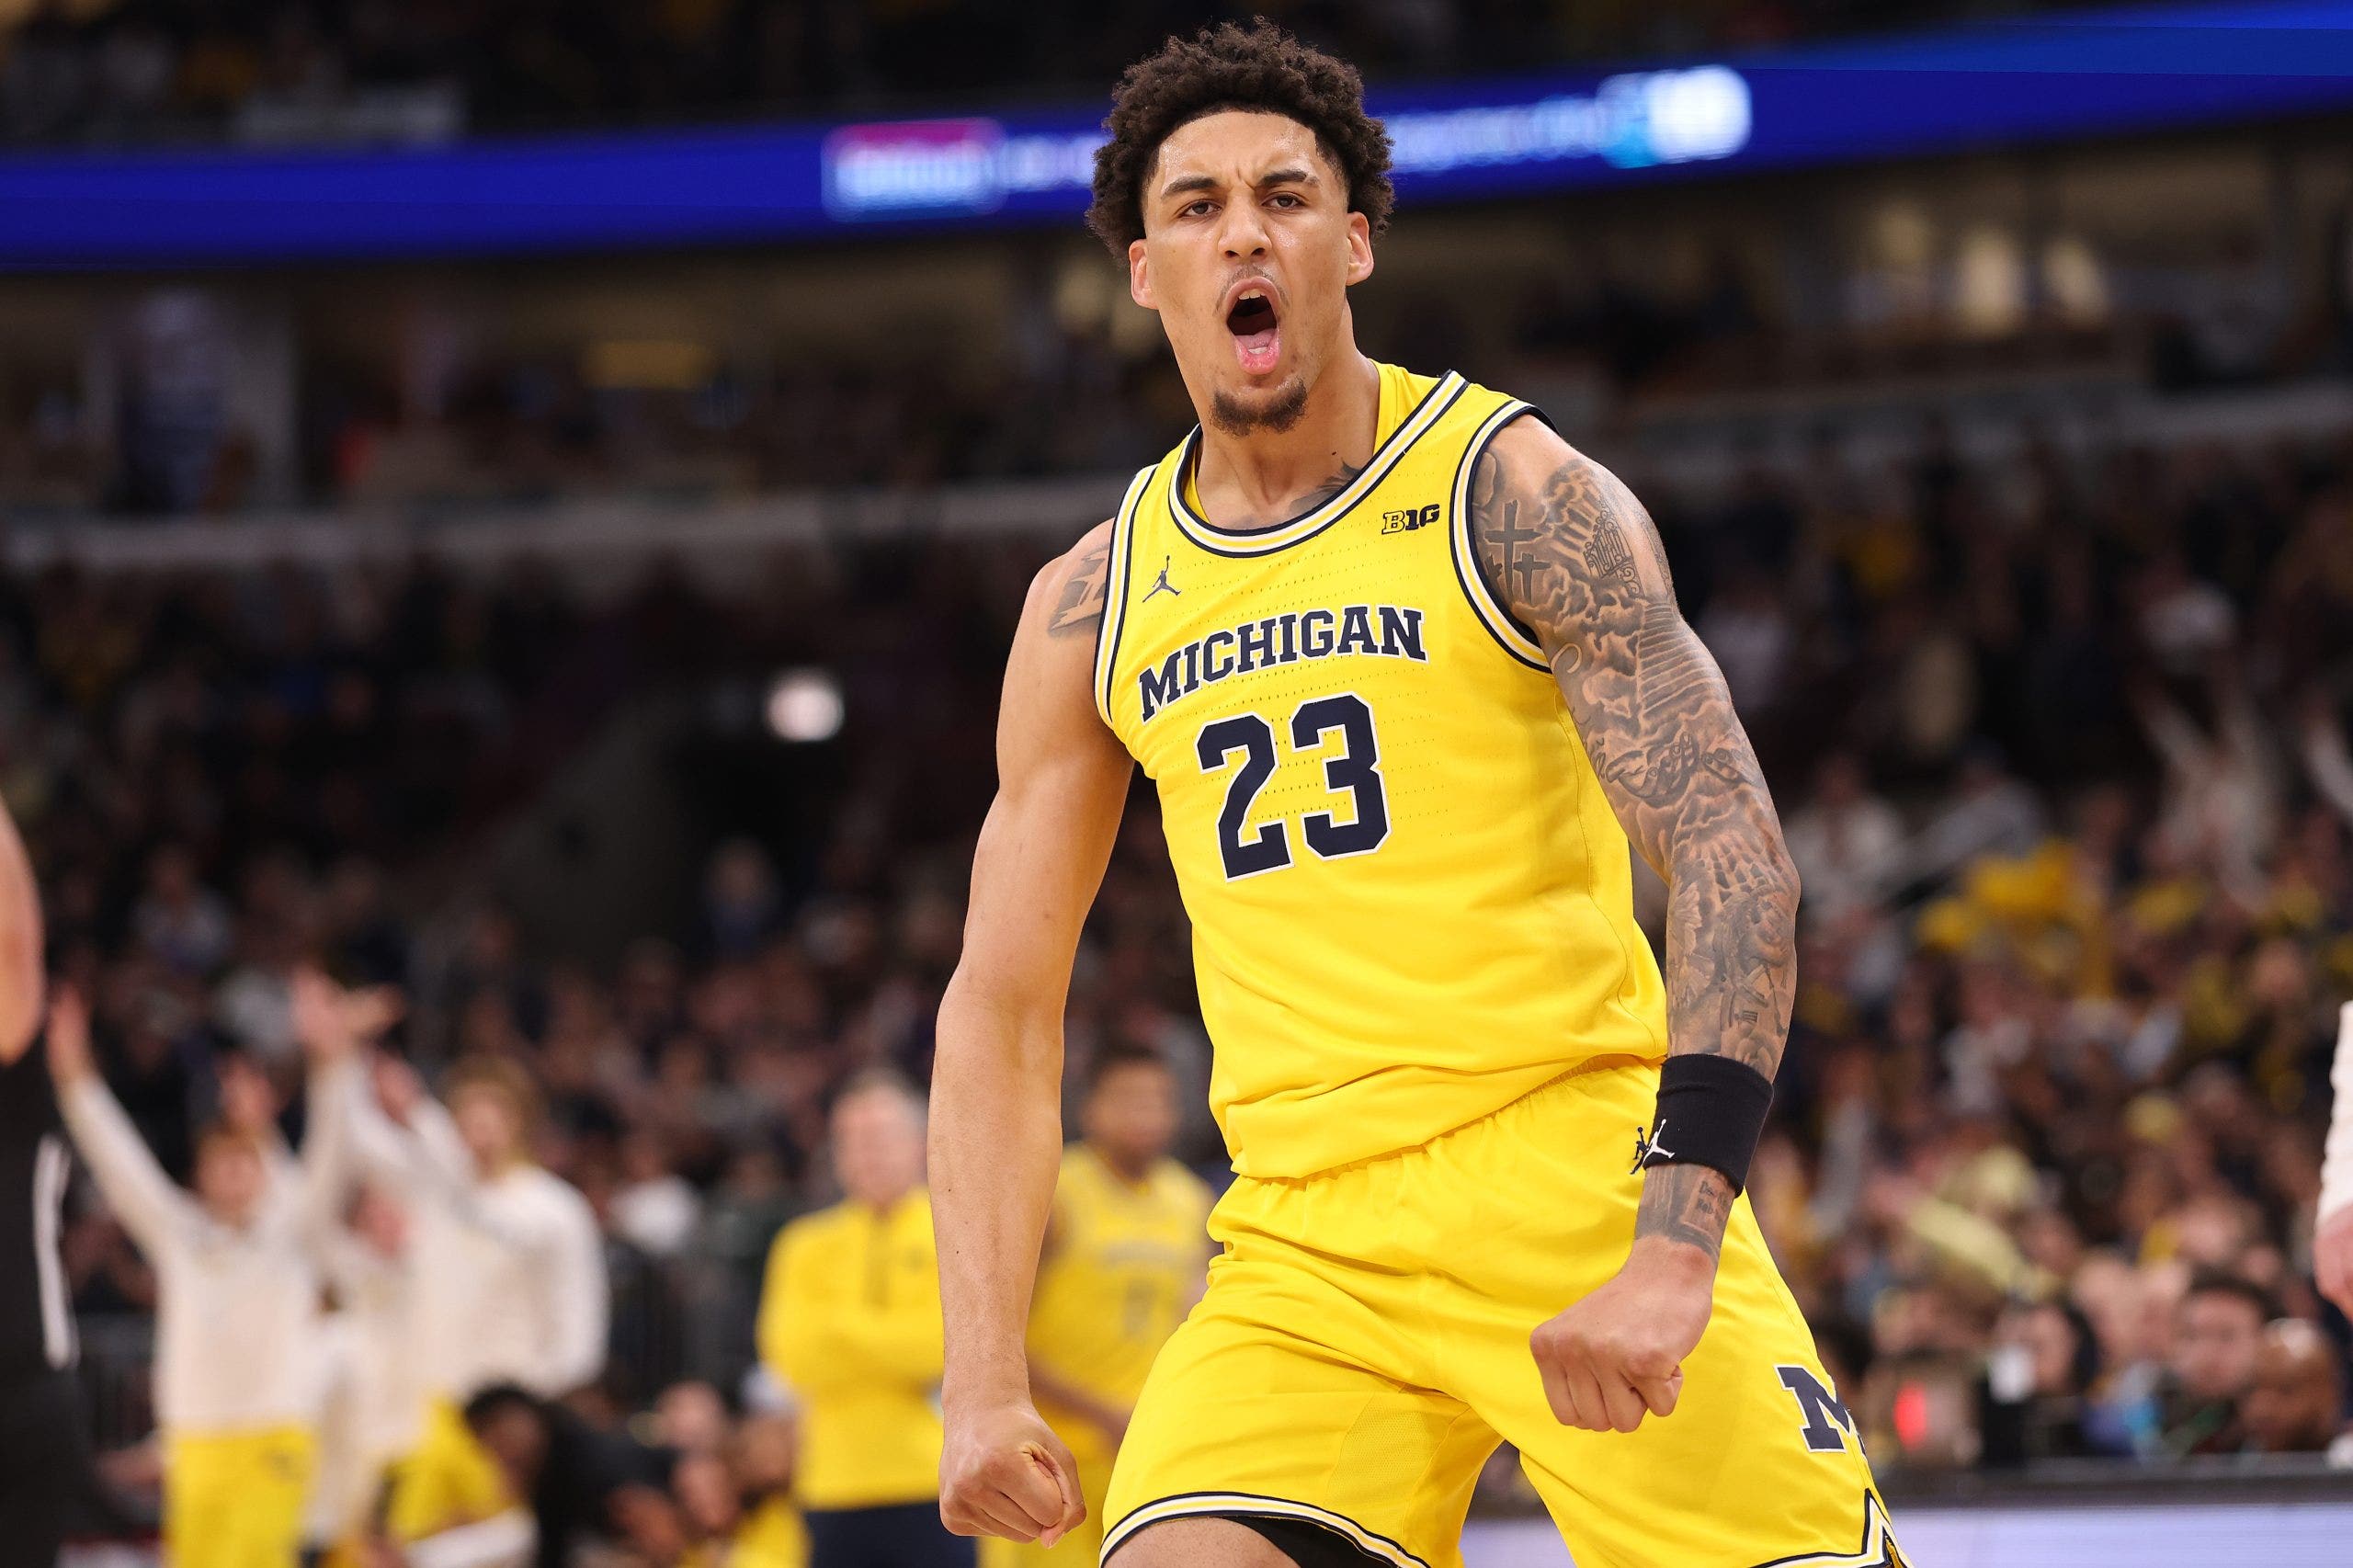
Yaxel Lendeborg de los Michigan Wolverines. (Foto de Michael Reaves/Getty Images)
Florida
- Adjusted offensive efficiency rank: 9
- Adjusted defensive efficiency rank: 6
- Adjusted efficiency margin rank: 4
houston
- Adjusted offensive efficiency rank: 14
- Adjusted defensive efficiency rank: 5
- Adjusted efficiency margin rank: 5
luisville
- Adjusted offensive efficiency rank: 19
- Adjusted defensive efficiency rank: 25
- Adjusted efficiency margin rank: 19
Estado de Iowa
- Adjusted offensive efficiency rank: 21
- Adjusted defensive efficiency rank: 4
- Adjusted efficiency margin rank: 6

Milan Momcilovic de los Iowa Cyclones. (Foto de Bryan Byerly/ISI Photo/ISI Photo vía Getty Images)
Los últimos 5 campeones de baloncesto masculino de la NCAA
A continuación se muestra un desglose de las clasificaciones de cada uno de los cinco campeones nacionales anteriores en cada categoría principal de KenPom (datos previos al torneo).
2025 florida
- Adjusted offensive efficiency rank: 1st
- Adjusted defensive efficiency rank: 10th
- Adjusted efficiency margin rank: 2nd
- Adjusted tempo rank: 59th
- Non-conference strength of schedule rank: 237th
- Luck rating rank: 100th
2024 Universidad de Connecticut
- Adjusted offensive efficiency rank: 1st
- Adjusted defensive efficiency rank: 11th
- Adjusted efficiency margin rank: 1st
- Adjusted tempo rank: 329th
- Non-conference strength of schedule rank: 83rd
- Luck rating rank: 95th
2023 Universidad de Connecticut
- Adjusted offensive efficiency rank: 6th
- Adjusted defensive efficiency rank: 18th
- Adjusted efficiency margin rank: 4th
- Adjusted tempo rank: 210th
- Non-conference strength of schedule rank: 208th
- Luck rating rank: 304th
2022 Kansas
- Adjusted offensive efficiency rank: 6th
- Adjusted defensive efficiency rank: 29th
- Adjusted efficiency margin rank: 6th
- Adjusted tempo rank: 68th
- Non-conference strength of schedule rank: 49th
- Luck rating rank: 88th
2021 Baylor
- Adjusted offensive efficiency rank: 3rd
- Adjusted defensive efficiency rank: 44th
- Adjusted efficiency margin rank: 4th
- Adjusted tempo rank: 179th
- Non-conference strength of schedule rank: 258th
- Luck rating rank: 80th


